Introducing Open Targets Mira: A Pipeline to Enhance Clinical Trial Evidence in the Open Targets Platform
Nine out of ten drugs that enter clinical development don’t reach patients. A common reason for that is that drugging the target simply doesn't work the way we thought it would in humans, or there are intolerable side effects.
Human genetic evidence helps us understand targets that are causal for disease, but doesn’t provide the full picture of whether modulating those targets with a drug, in patients who already have disease, at particular stages of disease progression, will produce a meaningful clinical benefit.
Evidence from clinical trials (which in this post we will call “clinical trial evidence”) provides a complementary layer, showing how potential disease treatments actually behave in patients, and how interventions perform across diverse clinical contexts. Clinical trial research also records much more than whether a drug is effective: we can learn which patients subgroups were responsive, which biomarkers were used to select patients and at what stage intervention matters most or which targets can be successfully drugged by which modalities? There are many questions that separate a promising target from a viable drug programme.
In this post, we introduce Open Targets Mira, our new clinical mining pipeline released in March 2026, how we envision the integration of this drug-indication evidence with the rest of the Open Targets Platform, and how you can use Mira yourself to extend our analyses with your own research questions.
Glossary
- Clinical Report: broad concept that captures any piece of evidence coming from a clinical trial or drug source. It could be a clinical trial, an indication listed on a drug label, or a report about a drug issued by a regulatory agency. A clinical report typically links a drug to a disease from a specific source, at a specific development stage.
- Clinical Indication: derived from clinical reports, where each record represents the aggregation of all drug/disease pairs across every report we have for that combination. Only reports with drugs mapped to ChEMBL and diseases mapped to EFO identifiers are included. This dataset harnesses the harmonisation we have done previously: for example, we can determine what the maximum clinical stage is across all reports linking ivacaftor to cystic fibrosis, regardless of how each individual source described it.
- Clinical Precedence: the target/disease relationships we infer from drugs. Knowing that brodalumab is indicated for psoriasis by binding to the IL-17 receptor, we can establish the role of IL17RA in the disease. Each piece of evidence connects a target to a disease via a drug, using mechanism of action data as the bridge.
To know more, visit our documentation.
What we have built
Clinical trial evidence is scattered across trial registries, regulatory agency websites, drug labels, curated databases, etc each using their own vocabulary to describe what is essentially the same thing: a drug being tested or used for a disease.
Open Targets Mira (Multi-source Indication & Report Analytics), our pipeline of clinical trial data, brings this together. It integrates data from 23 sources spanning the full clinical development lifecycle from early exploratory studies registered on ClinicalTrials.gov, to approved drug labels from DailyMed, the Japanese Pharmaceuticals and Medical Devices Agency (PMDA), and the European Medicines Agency (EMA), to curated indication records and withdrawal notices.
Due to the continual production of this data type, the pipeline is envisioned as a living resource. We first ran the pipeline around our Platform 26.03 release providing 285,213 clinical reports across 13 development stages; by release 26.09, re-running the pipeline provided 289,954 clinical reports.
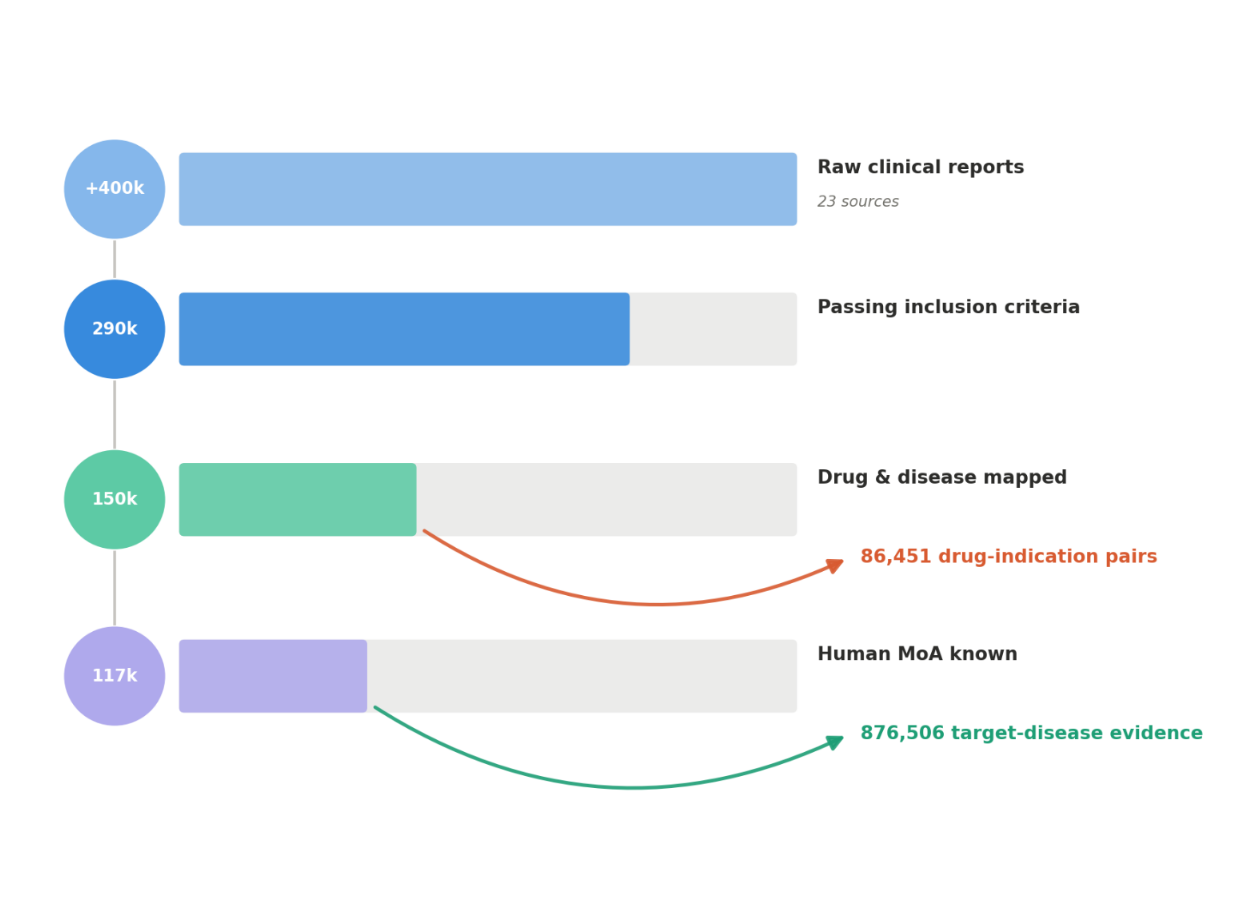
We are able to analyse this information at scale thanks to harmonisation across these data sources. After mapping drugs and conditions to ChEMBL and EFO identifiers respectively, every report is assigned a stage from a common clinical stage vocabulary, from Preclinical and Investigational New Drug (IND) through the standard Phase I–IV progression to Approval and Withdrawal. This makes it possible to rank evidence across sources and determine the highest stage of clinical evidence. For our largest source, ClinicalTrials.gov, we also enrich the information we extract from each report.
Automatic extraction of drug indications from trials
Previously, our approach to annotating clinical trials involved a combination of automatic extraction from the labels available on ClinicalTrials.gov, supplemented by manual curation by the ChEMBL team whenever those labels had some degree of ambiguity. Although our data was usually a good representation of the intention of the study, manual curation was labour intensive and difficult to carry out at pace. Additionally, for many of the more complex trials, the free-text labels didn’t have enough context for us to capture the trial’s complexity.
In June 2026, we introduced an LLM framework to capture the purpose of a study and extract the drug and indication under investigation from the free-text titles, descriptions, interventions and conditions of ClinicalTrials.gov records.
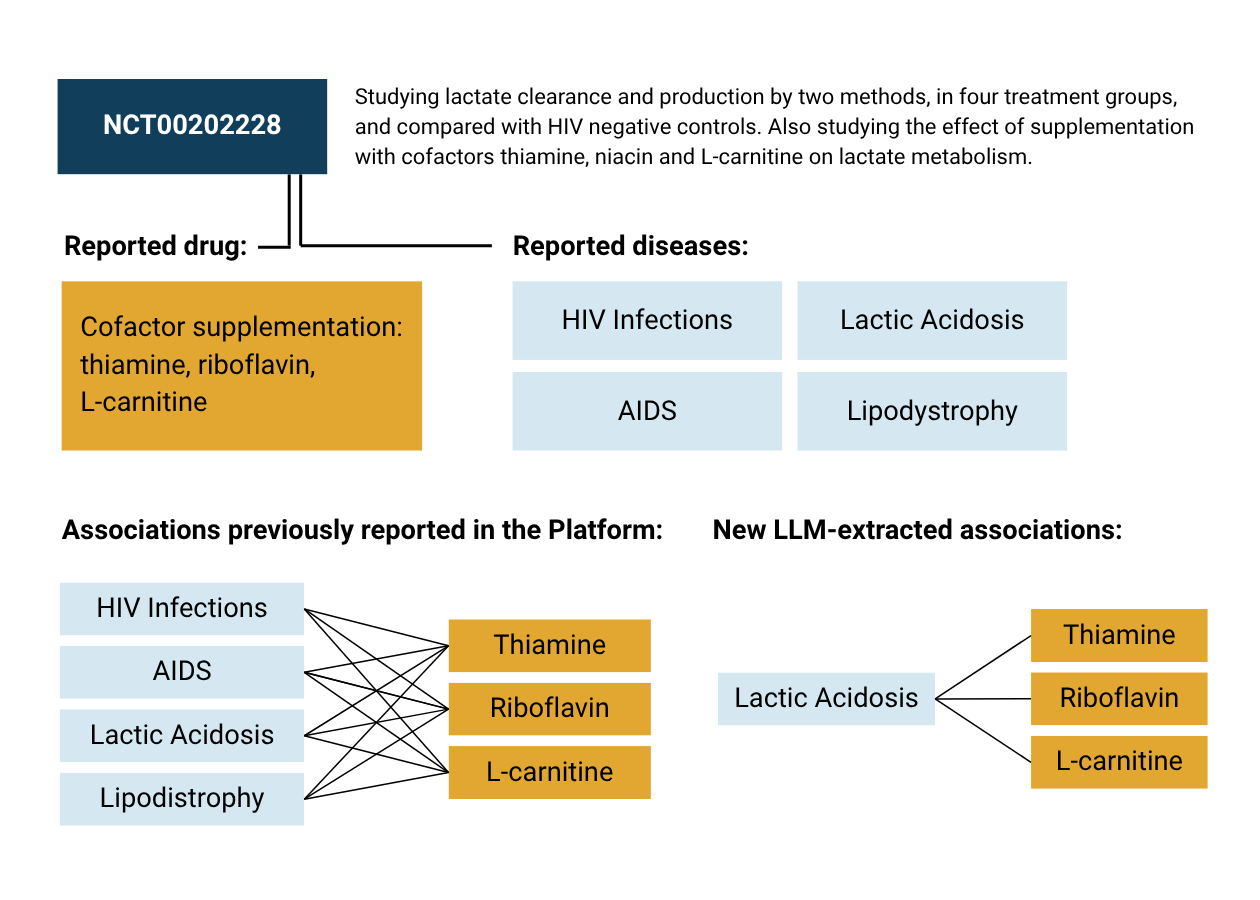
The LLM extraction expanded the number of drug-indication pairs and reduced false associations. We developed the extraction against a manually annotated benchmark, and every new run is evaluated automatically to ensure the quality holds over time as we integrate new trials.
Improving drug information in the Platform
The clearest way to see the impact of the new data is to compare the maximum assigned clinical stage of every drug present before and after our clinical data was updated (25.12 vs 26.09), regardless of the indication.
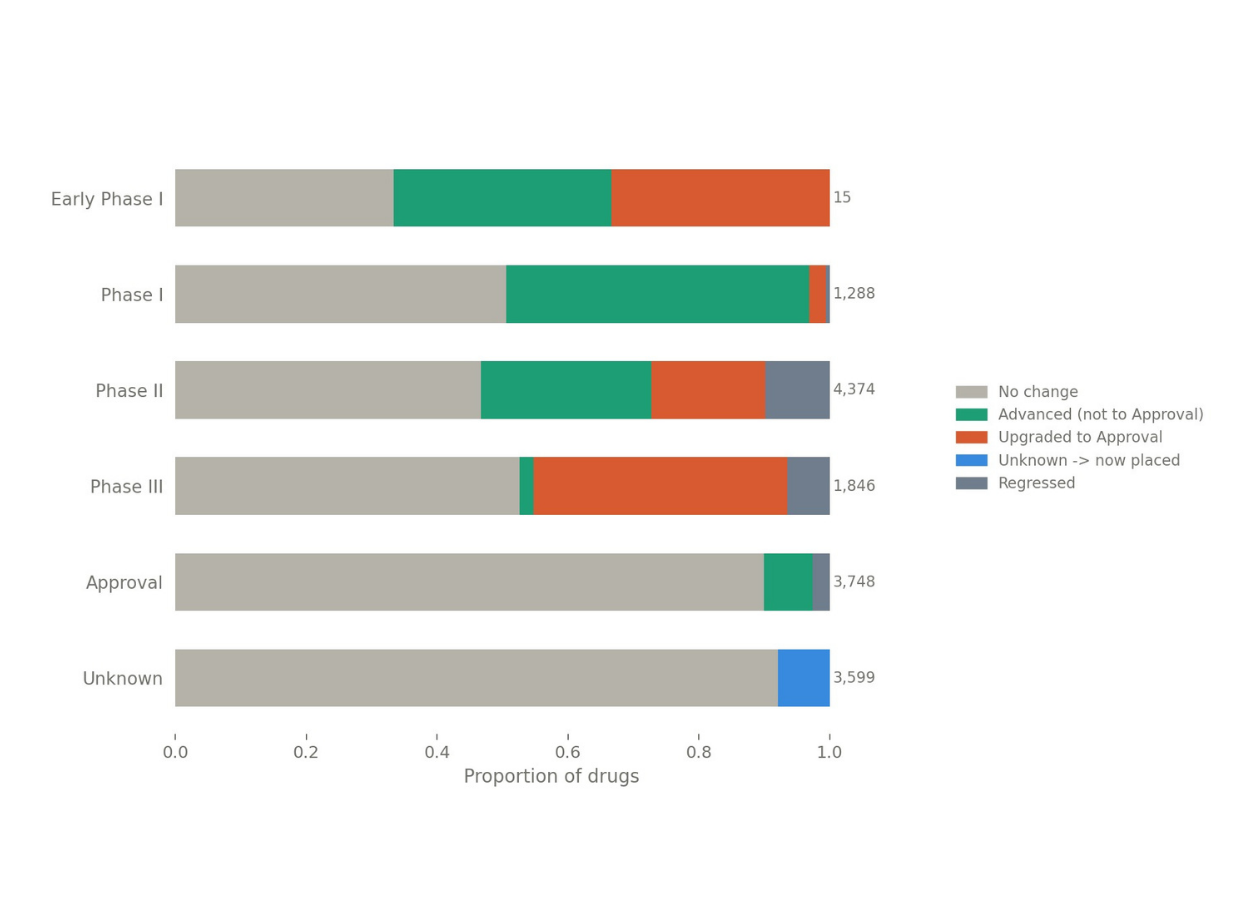
The plot shows very striking updates in the clinical stage status across phases, where the new clinical trial information updated our previous data. In particular, roughly a third of drugs previously reported as Phase III were upgraded to Approval following the update, because we now have a more up-to-date regulatory label to support this information. The same pattern holds at Phase II, where a significant fraction of drugs were either upgraded to Approval or advanced to a higher trial phase. Even at Phase I, close to half of all drugs saw their stage updated. As we could expect, drugs already at Approval are largely stable as this is the stage where manual curation is predominantly focused, while the Unknown category (drugs for which we cannot derive reliable stage information) remains mostly unresolved.
Based on this, we are confident the Mira pipeline helps us stay more current and accurate with every release cycle.
A new indications widget
Once clinical reports are collected, they are aggregated into clinical indications (one record per drug-disease pair), consolidating everything we know about that drug-disease pair across all sources and all stages. As of the September 2026 release (26.09), we had 11,418 drug-disease pairs. This data is what powers the Indications widget on every Drug page in the Platform.
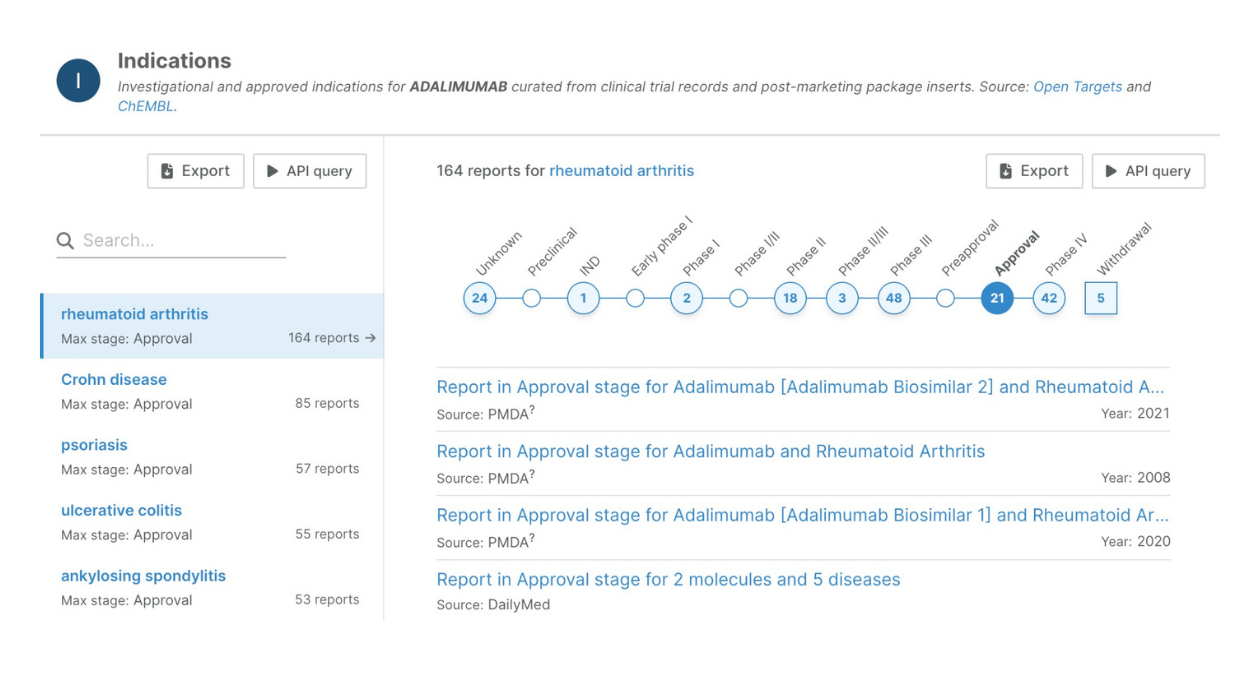
The indications widget shows you all reports for a drug-disease pair, to help reconstruct their clinical journey. What we observe is that multi-source corroboration is strongly stage-dependent. At Approval, 55% of indications have at least two supporting reports, and 41% have three or more. At Phase I, the picture is almost entirely single-report. Earlier-stage evidence is sparser by nature, often coming from a single trial.
From drug indications to a target clinical precedence
Drug-indication pairs tell us which therapies are being investigated or used for a disease. When we also know a drug’s mechanism of action, we can connect those clinical reports to target-disease pairs, capturing the clinical precedent for pursuing that target in that indication.
This is the foundation of our Clinical Precedence dataset. It replaces what was previously labelled “ChEMBL” in the Platform, and it was the most significant change to target-disease evidence when we introduced this data in the 26.03 release. ChEMBL curation remains an important source in Open Targets Mira, but the dataset now integrates evidence from across the full clinical mining pipeline.
Key numbers from the Clinical Precedence dataset from our 26.09 release:
| Number of... | |
|---|---|
| Evidence | 876,506 |
| Contributing clinical trials | 94,480 |
| Target/disease associations | 106,998 |
| Diseases | 3,115 |
| Targets | 1,519 |
| Drugs | 4,460 |
Each piece of evidence corresponds to a single clinical report, with the target/disease link inferred by joining the drug/disease relationship in that report with drug-target data from ChEMBL. In total, 117,152 clinical reports contribute to the evidence, mostly coming from clinical trials (94,480). Stage granularity has also expanded: evidence now spans 13 harmonised clinical stages, and scoring reflects this directly: associations supported by later-stage reports receive higher scores.
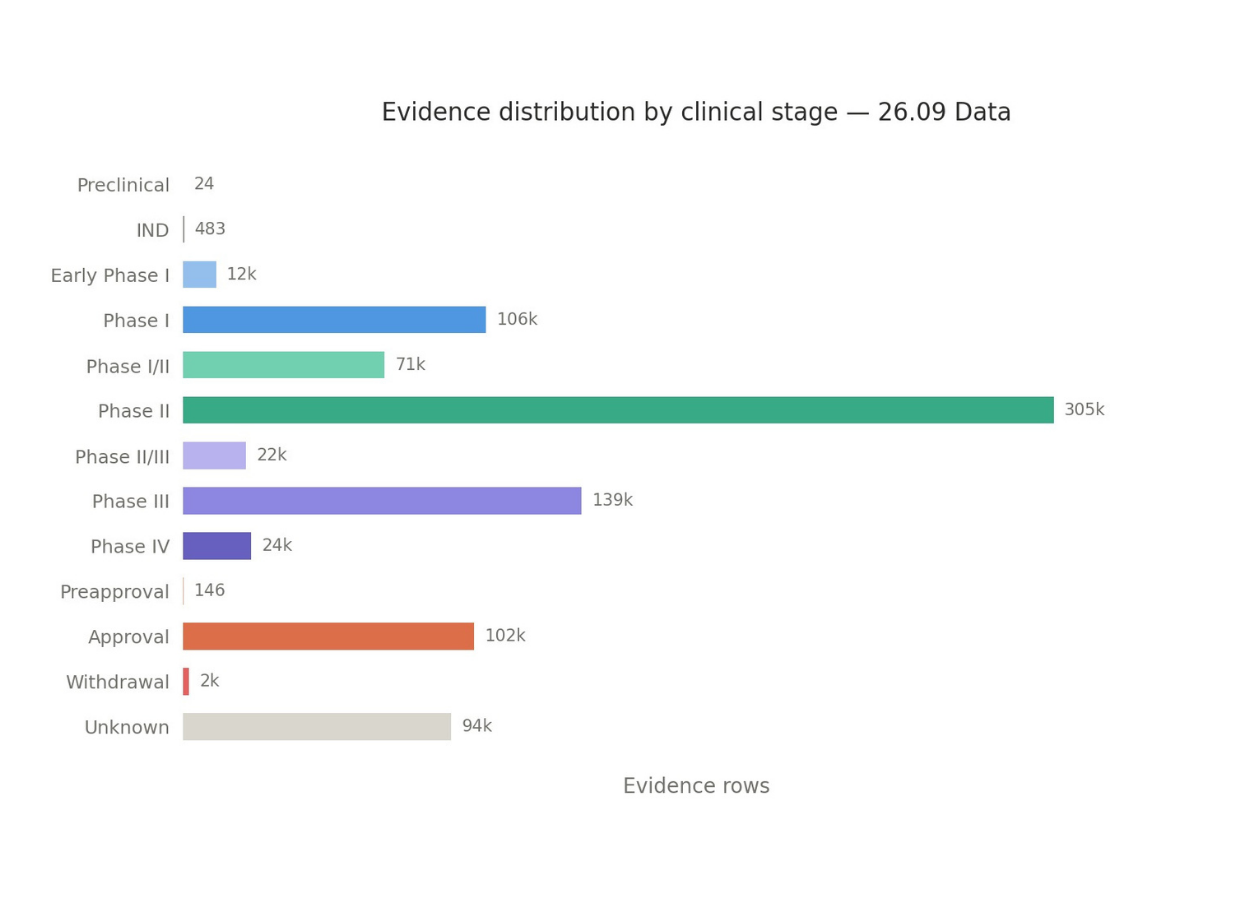
Although the curation made by ChEMBL is a key source of clinical precedence evidence, the new dataset does not include all the associations that were previously available. Making a direct comparison is challenging: in some cases, the differences arise because a term in our ontology (we use EFO) has been assigned that better represents the condition studied in the clinical trial, while in others, the current fully automated pipeline is unable to reproduce associations that were captured before.
Since clinical data is inherently complex, the new clinical precedence dataset has been extensively benchmarked to strike a balance between recovering high-confidence associations derived from ChEMBL and incorporating new associations supported by new reports, while avoiding spurious links between targets and diseases that do not share a common biological basis.
| Clinical Development Band |
Common T-D Pairs |
# Increased |
# Degraded |
Avg Evidence Score Drop |
Avg Evidence Score Gain |
|---|---|---|---|---|---|
| Early development (<= 0.2) | 28,230 | 9,510 | 2,197 | -0.098 | 0.323 |
| Transitional (0.2–0.5) | 142 | 49 | 35 | -0.170 | 0.295 |
| Late clinical (0.5–0.8) | 13,483 | 837 | 3,220 | -0.500 | 0.300 |
| Approved / post-approval (> 0.8) | 6,015 | 0 | 244 | -0.395 | - |
Comparing evidence scores for the 47,870 target-disease pairs present in the 26.09 and the 25.12 releases gives a sense of what has actually shifted. For pairs in early clinical development (scores up to 0.2), over 9,500 saw a meaningful evidence score improvement, with an average gain of 0.323. This indicates the pipeline is surfacing trial activity that we didn’t previously capture, and increasing the confidence that targets are actively being pursued, even if they haven't reached late-stage development.
It is also important to acknowledge the insight in the late clinical band. Among the nearly 13,500 pairs with scores between 0.5 and 0.8, around 3,200 saw their evidence score drop, with an average decrease of 0.5. This means that these associations previously appeared to have strong late-stage clinical precedence but now sit lower in the ranking. CTLA4-cutaneous melanoma provides a useful example. Its score decreased from 0.7 to 0.2 because two Phase III ipilimumab trials previously assigned to cutaneous melanoma (NCT01274338 and NCT02506153) are now mapped to the broader melanoma indication. This shows that some downgrades reflect a genuine loss of indication specificity on the disease definition that the LLM extraction does not retrieve, rather than a change in the underlying clinical development.
Given our benchmarking and validation, we are confident that our overall estimate of clinical evidence is now more accurate and up-to-date, with stage values supported by traceable, source-attributed reports.
Further developments
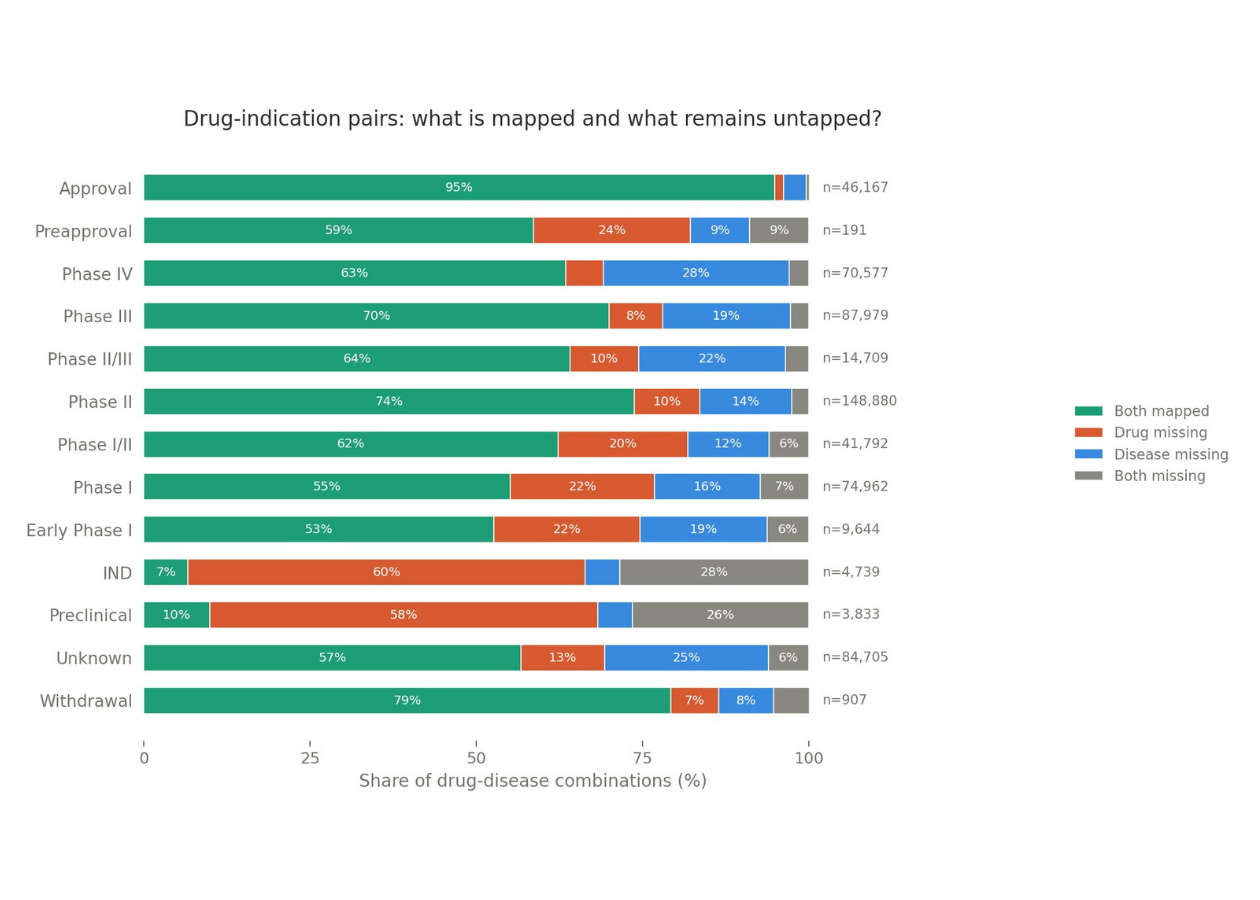
Mira is a new foundation that we want to continue to improve. In particular, although more than 290,000 clinical reports pass our inclusion criteria, less than half of these actually contribute to target-disease evidence because they cannot currently be accurately mapped to an ontology. For a report in our pipeline to be presented in the Platform, its relevant entities need to be mapped to identifiers we can work with (a ChEMBL ID for the drug, an EFO ID for the disease).
At Approval, where drugs have well-established names and indications are clearly defined on regulatory labels, over 90% of reports are fully mapped, but this falls to 55% by Phase I, to under 10% for Preclinical. But early phases where novel targets first appear are the most interesting signals for drug discovery, and so one of our priorities is to shed light on those missing connections (in grey in the figure below).
An extendable pipeline
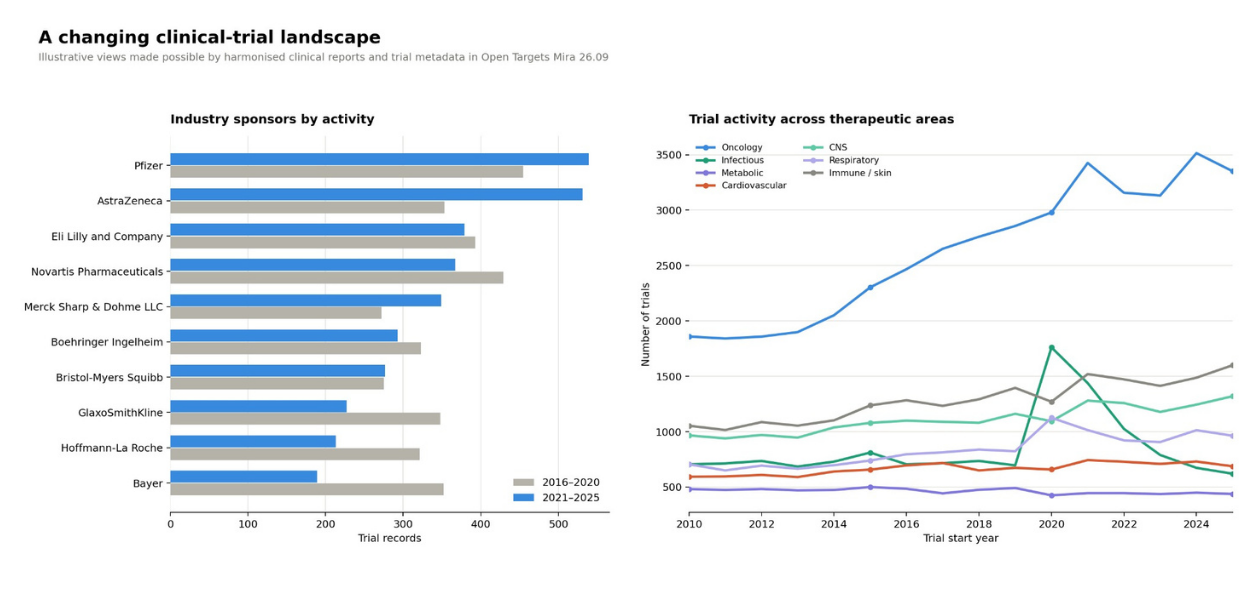
We built Open Targets Mira to be modular, to create a useful framework to explore the clinical landscape. The output that matters most for the Open Targets Platform is drug-indication coverage, but because we can easily extend the metadata around each clinical report, the Python package can be flexed to answer a variety of questions, e.g. that the proportion of trials conducted outside of the US (less than 20%), how trial activity maps across industry sponsors, and how the therapeutic areas represented in registered trials have changed since 2010, as shown in the figures below. These are illustrative analyses, but they demonstrate how users can extend the same harmonised data to answer questions that are relevant to their research.
What do you think of our new pipeline? Are there any data or changes you’d like to see? Let us know on the Open Targets Community!