How we improved Locus-to-Gene scoring representation in the Open Targets Platform
The Black Box Problem in L2G Scoring
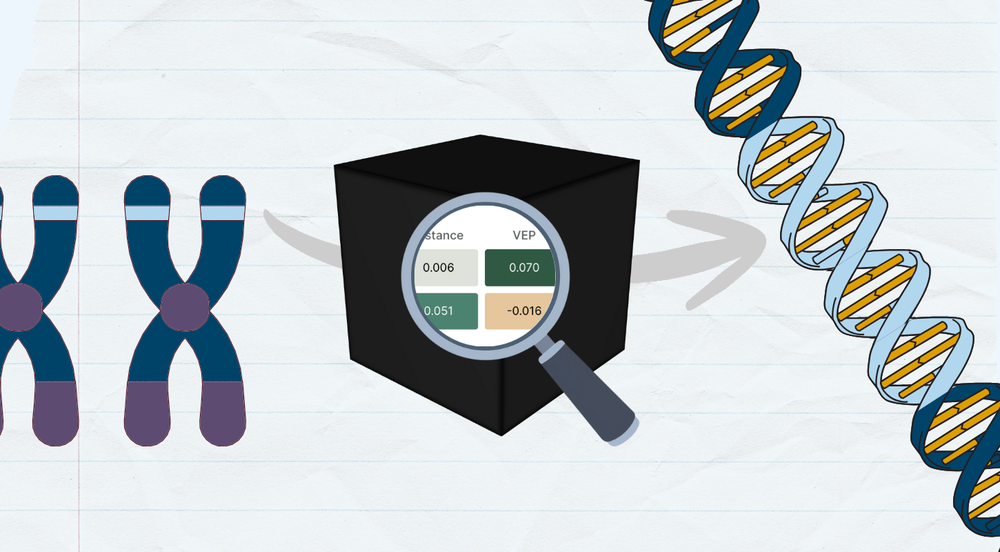
In the world of genetic association studies, the Locus-to-Gene (L2G) algorithm is an important tool for prioritising genes that may be causally linked to disease-associated non-protein coding regions. However, despite its effectiveness, the L2G scoring system presents the typical concerns of most machine learning (ML) algorithms: explainability.
We recently re-engineered our L2G pipeline, as well as the representation of its results within the Platform. Our initial prototype of the Locus-to-Gene widget, shown here for a locus associated with rheumatoid arthritis, was fairly basic:
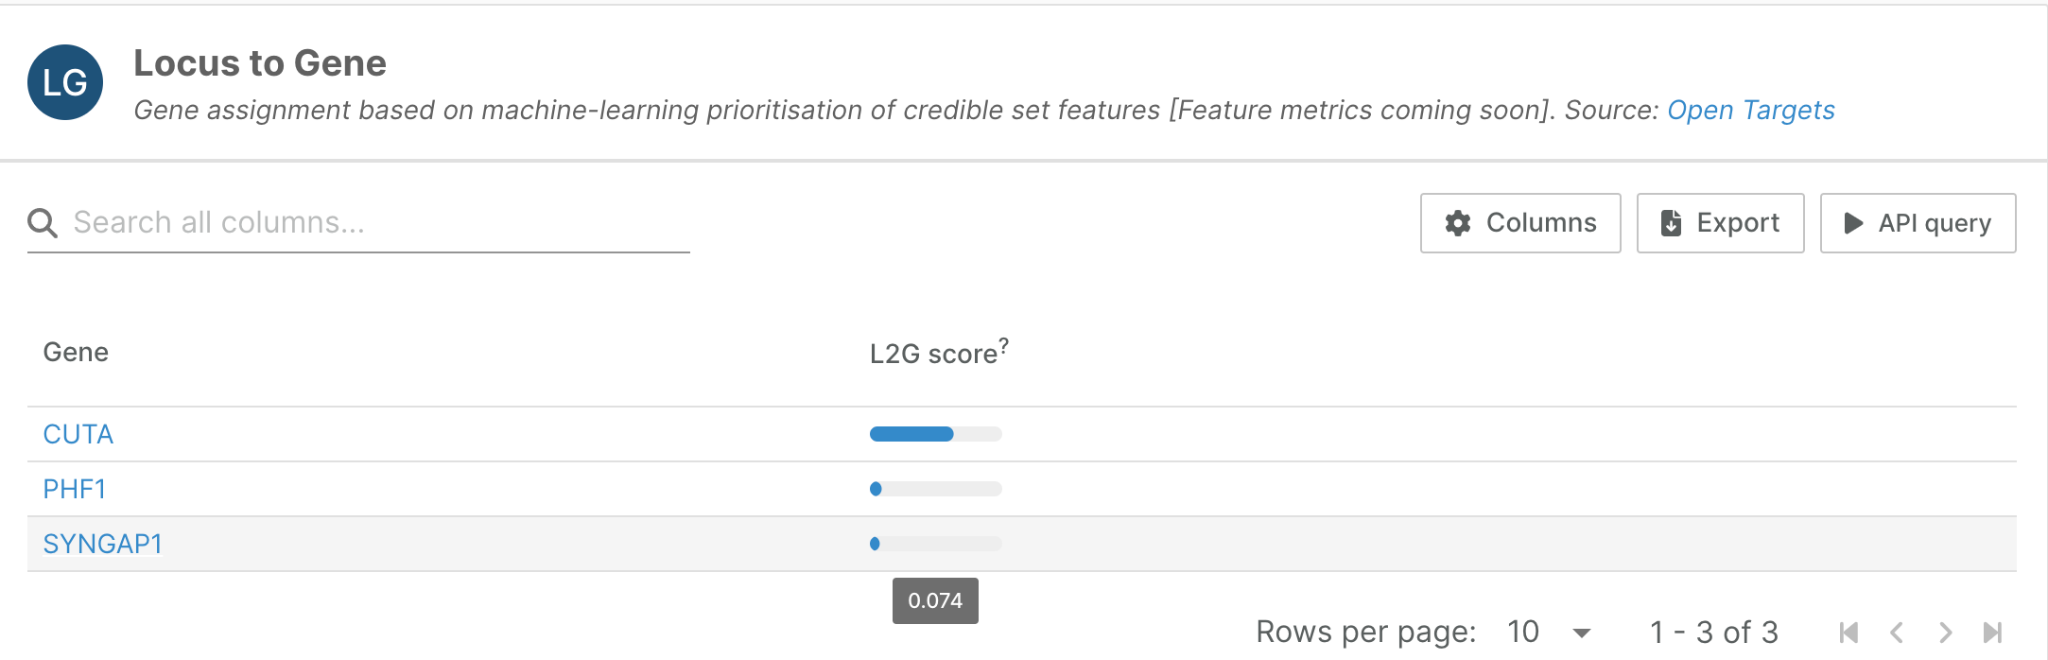
But when we see that CUTA receives a high L2G score of 0.85 while SYNGAP1 scores only 0.07, we might ask: Why is CUTA's score higher? What specific evidence drives this prediction? How can we trust these results?
The L2G algorithm integrates multiple sources of functional annotation evidence—from gene proximity to colocalisation with molecular quantitative trait loci (mQTLs)—but users couldn't easily understand which features contributed most to any given score. This lack of interpretability has been a significant limitation in translating L2G predictions into interpretable genetic functional mechanisms.
We recognised that this interpretability challenge could be addressed by leveraging machine learning explainability algorithms. Specifically, we have implemented Shapley value-based explanations for L2G scores. This transforms our L2G widget from a simple score display into an interpretable analysis tool that reveals how each piece of functional evidence contributes to the final prediction.
What Are Shapley Values and Why Do They Matter?
Shapley values originate from cooperative game theory, developed by Nobel laureate Lloyd Shapley in 1953. The core problem they solve is elegantly simple: how do you fairly distribute rewards among players who contribute differently to a team's success?
The Intuition Behind Shapley Values
Imagine two researchers collaborating on a grant application. Working alone, Researcher A could secure £75,000, while Researcher B could obtain £50,000. Together, they obtain £100,000. How should they split this funding fairly?
The Shapley value calculates each player's expected marginal contribution across all possible joining orders:
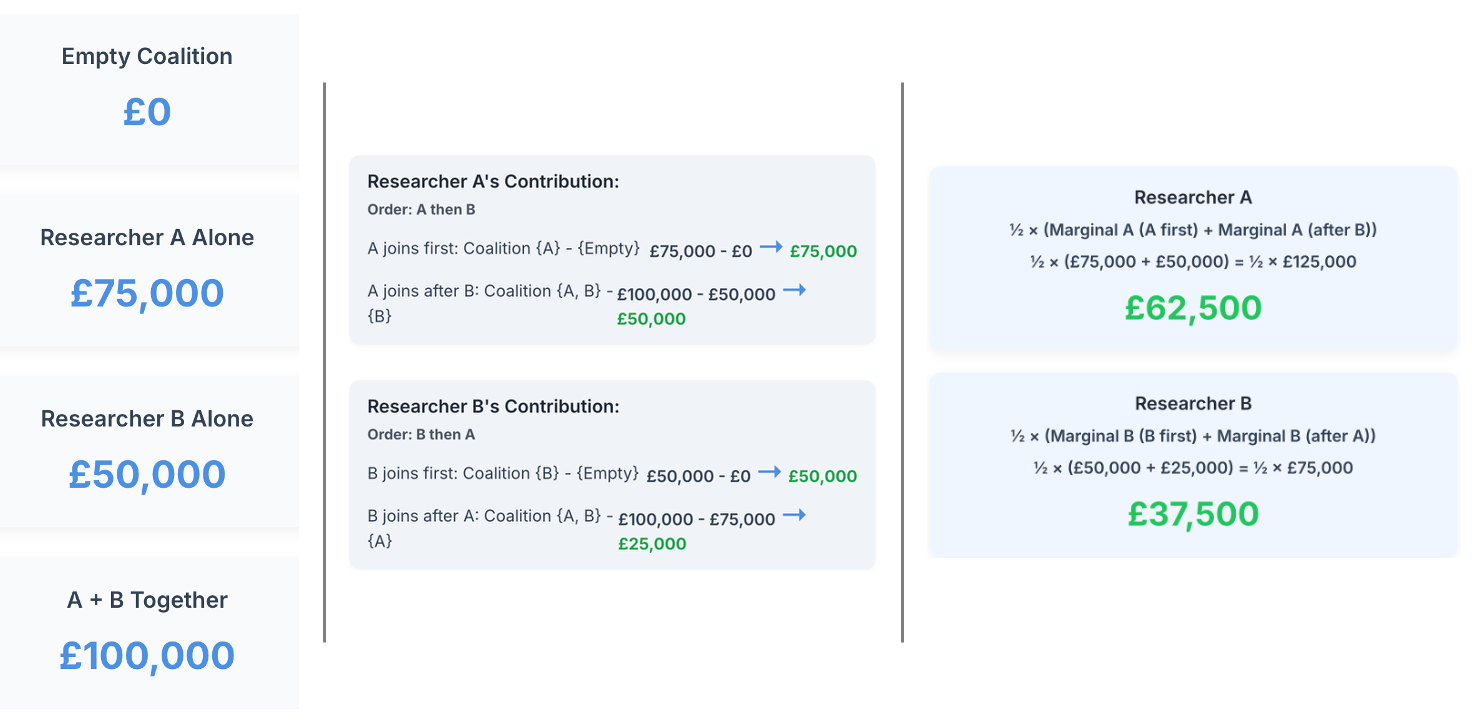
Now, the calculated marginal contribution of each researcher to the total grant represents the Shapley value for each researcher.
The same mathematical framework can be applied to machine learning interpretability. Instead of researchers, we have functional genomics features. Instead of grant money, we have the L2G score. The Shapley value tells us each feature's fair contribution to the final prediction.
Why Shapley Values are ideal for L2G Interpretation
Shapley values are characterised by four crucial mathematical properties that make them ideal for explaining L2G scores:
- Efficiency: All feature contributions sum to the difference between the prediction and the baseline
- Symmetry: Features with identical contributions receive equal Shapley values
- Null player: Features that don't affect the prediction receive zero contribution
- Additivity: The framework handles complex feature interactions appropriately
Most importantly for L2G applications, Shapley values account for feature interactions. When colocalisation evidence and variant effect data both point to the same gene, their combined effect might be greater than the sum of their individual contributions. Shapley values capture this synergy naturally.
Our Technical Approach to Implementing Shapley Values in L2G: the SHAP Library
While the mathematical concept of Shapley values is elegant, calculating them exactly for complex machine learning models is computationally intensive. For a model with n features, there are 2^n possible feature combinations to consider. With L2G's 28 features, this becomes intractable across our more than a million credible sets.
To calculate each marginal contribution per prediction, we leverage the SHAP (SHapley Additive exPlanations) library, which implements efficient approximation algorithms based on Monte Carlo sampling. This approach maintains the theoretical principles of Shapley values while making computation feasible for real-world applications.
Interpreting L2G Shapley Values: A Practical Guide
Understanding the Visualisations
The L2G widget in the Open Targets Platform transforms complex model predictions into interpretable explanations and clear visualisation. There are 3 core principles for their interpretation:
- Magnitude: Larger absolute values indicate more influential features
- Direction: Positive values increase the L2G score, negative values decrease it
- Additivity: All contributions plus the base value add up to the final L2G score
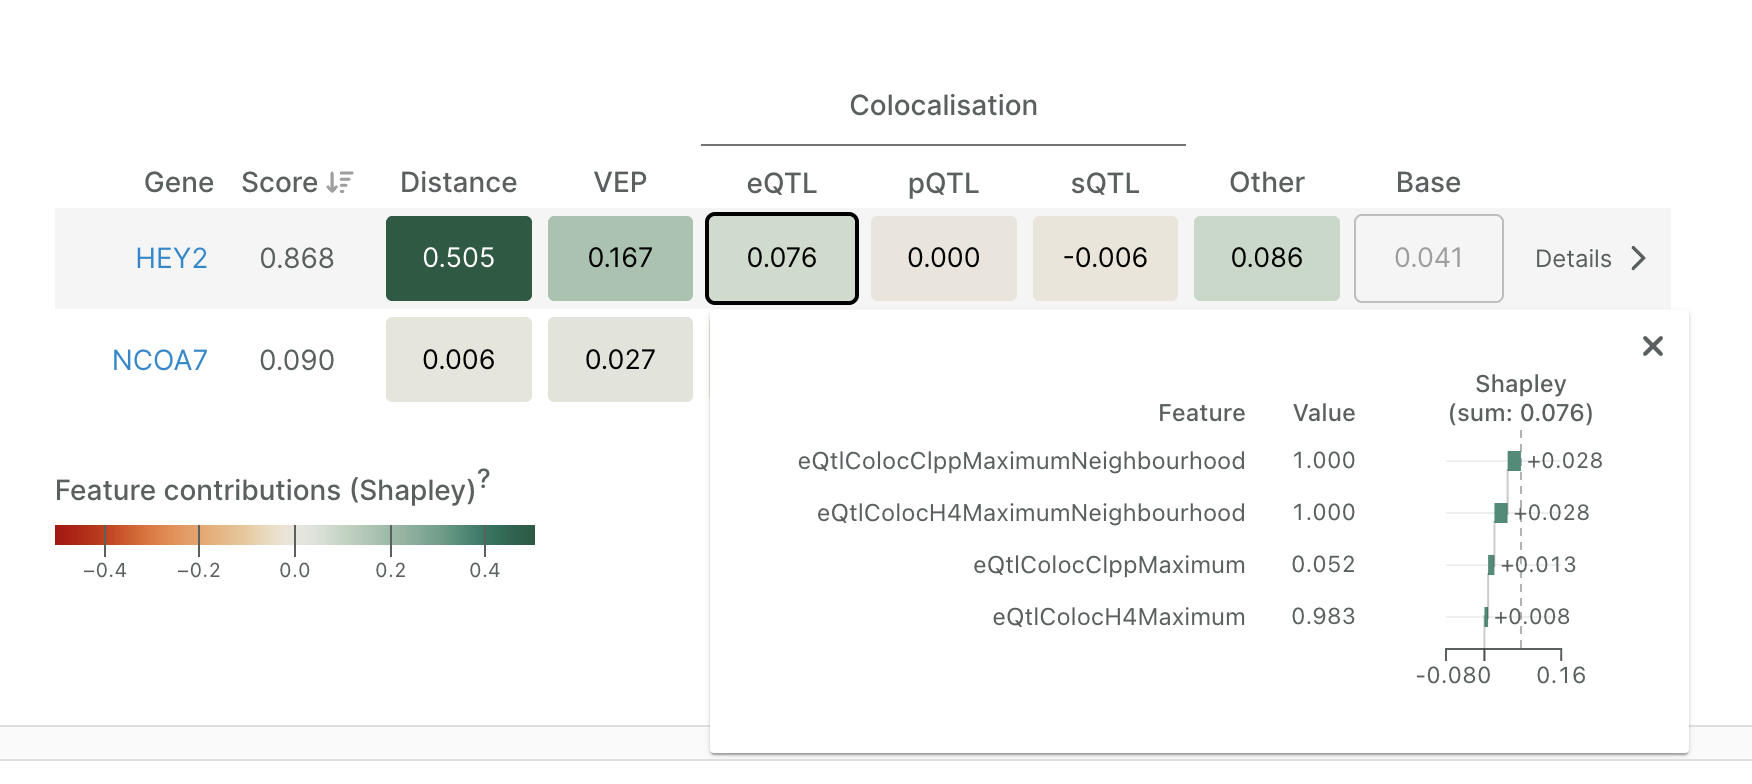
For example, let's look at this L2G analysis of a credible set that prioritises HEY2 as a causal gene in Brugada Syndrome (lead variant: 6_125743774_T_A, study ID: GCST90295916):
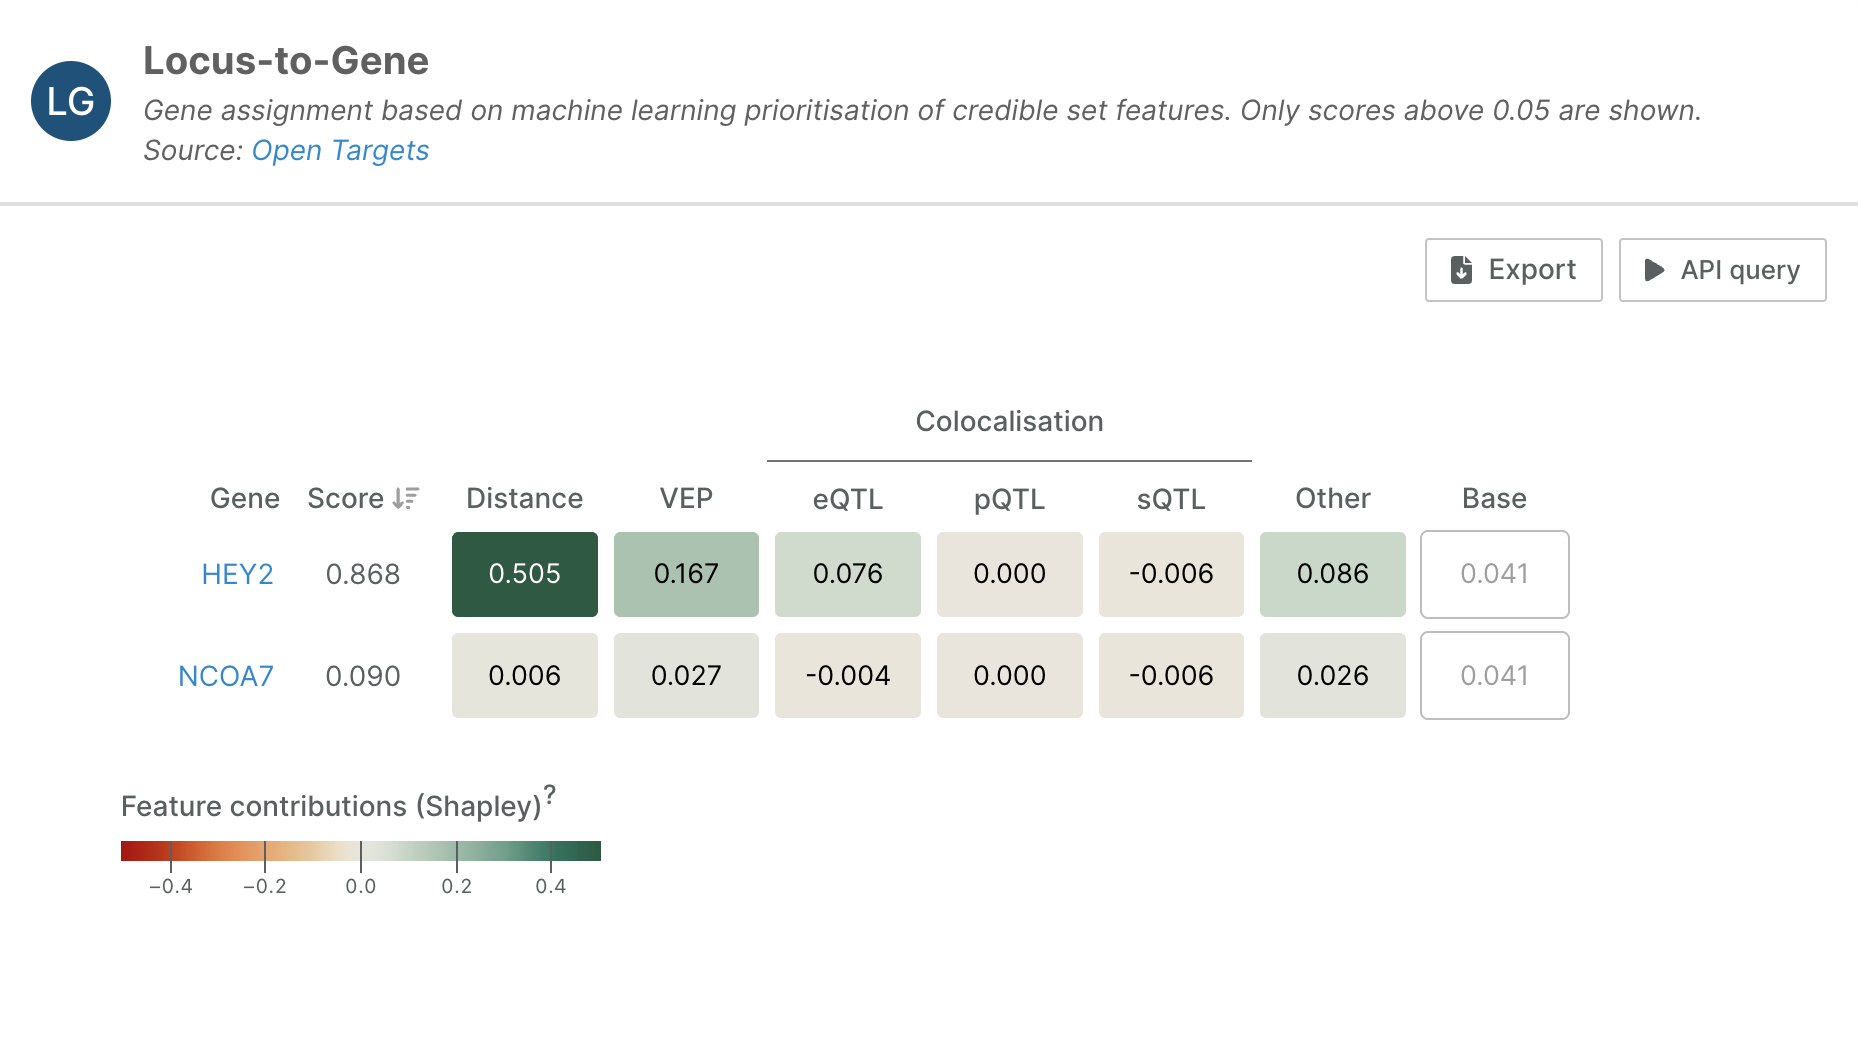
In the widget, each row represents a different gene's L2G prediction, with feature contributions grouped into categories: Distance, VEP (Variant Effect Predictor), mQTL Colocalisation, and Other evidence types. The base value is a constant that represents the model’s baseline prediction, i.e. the expected L2G score before considering any gene-specific evidence.
The analysis reveals that HEY2’s high L2G score is primarily driven by strong distance-based evidence (0.505) and substantial VEP evidence (0.167). The VEP contribution suggests that variants in this region have a significant predicted functional impact on the HEY2 gene, while the distance evidence indicates favourable proximity relationships between the disease-associated variants and this gene.
Reading the Evidence
Clicking on any feature group reveals individual feature contributions. For instance, expanding the eQTL group for HEY2 shows that several colocalisation-derived features jointly contribute +0.076 to the gene’s overall prediction score. These positive SHAP values indicate that strong eQTL colocalisation evidence increases the model’s confidence that HEY2 is the likely causal gene at this locus. To provide context, we have also included the value of each feature as it is incorporated into the model. In this example, the maximum colocalisation posterior probability (H4) is 0.983, indicating strong support for a shared causal variant between the GWAS and eQTL signals.
Limitations and Considerations
While Shapley values provide powerful insights, they're not without limitations:
- Feature Dependencies: When functional annotation features are correlated, Shapley values can produce counterintuitive results.
- Causal Inference: Shapley values describe associations, not causation. A high contribution from distance-to-gene doesn't mean proximity causes the association—it simply indicates that distance is predictive in the model.
- Model Limitations: Shapley values explain the model's predictions, not necessarily biological reality. If the underlying L2G model has biases or limitations, these will be reflected in the Shapley explanations.
Conclusion
The integration of Shapley values into L2G scoring transforms the post-GWAS analysis from a black box process into a more transparent number. This will hopefully build confidence in high-scoring genes by understanding the evidence supporting them, as well as help us debug unexpected predictions by identifying which features drive surprising results.
We encourage users to explore these new interpretability features and share their experiences with the community.